Publications:
If your are using any of the material below please cite the corresponding publication:
Description:
CTC (Covert Timing Channels) datasets consist of a mix of preprocessed network traffic data with and without covert timing channels. from two sources: (a) real traffic captures from the MAWI project (overt flows), and (b) synthetic traffic generated with a testbed based on published techniques for the generation of covert timing channels (covert flows).
Flow vectors contain relevant statistical information provided in variations of the DAT-format (reduced to only one feature: IAT). The DAT-format was originally proposed in:
Datasets, experiments:
-
Jun 2017 - ARES/CUING-2017 dataset
Details: 7 CTC techniques implemented. Overt flows contain, at least, 2 packets.
Used in: Félix Iglesias and Tanja Zseby. 2017. Are Network Covert Timing Channels Statistical Anomalies?. In Proceedings of the 12th International Conference on Availability, Reliability and Security (ARES '17). ACM, New York, NY, USA, Article 81, 9 pages. -
Jun 2017 - CD-MAKE-2017 dataset
Details: 8 CTC techniques implemented. Overt flows contain, at least, 2 packets.
Used in: Iglesias F., Bernhardt V., Annessi R., Zseby T. (2017) Decision Tree Rule Induction for Detecting Covert Timing Channels in TCP/IP Traffic. In: Holzinger A., Kieseberg P., Tjoa A., Weippl E. (eds) Machine Learning and Knowledge Extraction. CD-MAKE 2017. Lecture Notes in Computer Science, vol 10410. Springer, Cham. -
Nov 2017 - Feat_analysis-2017 dataset
Details: 10 CTC techniques implemented. Overt flows contain, at least, 10 packets. 5 new randomness/regularity features are added.
Used in: Iglesias F., Annessi R., Zseby T. (2018) Analytic Study of Features for the Detection of Covert Timing Channels in Network Traffic. In: Journal of Cyber Security and Mobility, Vol: 6, Issue: 3, Pages: 225-270.
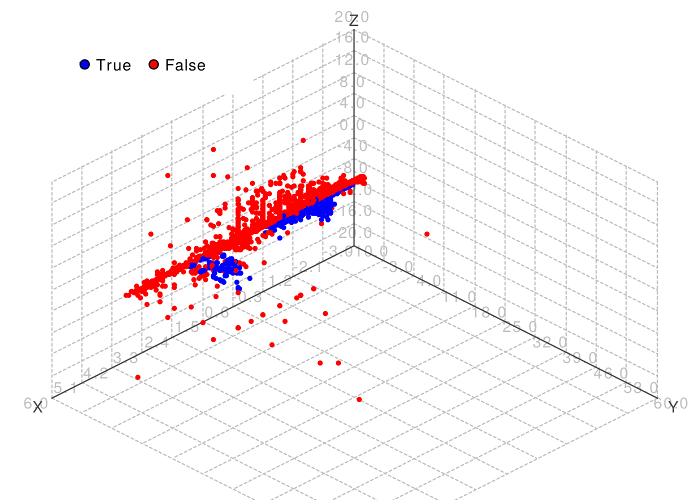
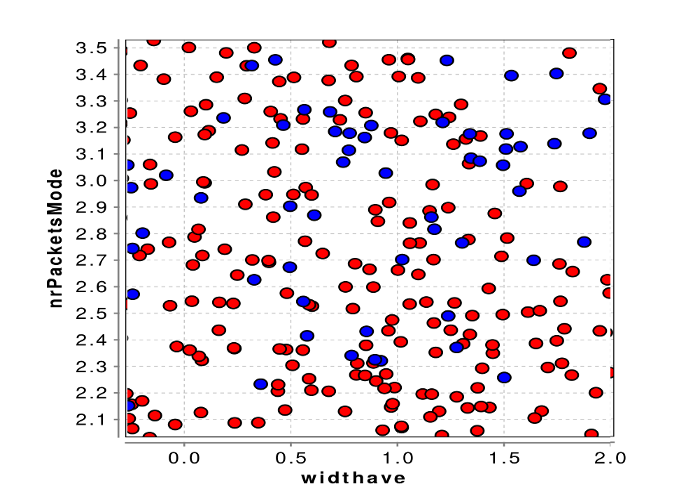
Example figures:
3D-scatter plot of the dataset (left) and detail (right). Blue dots correspond to flows with covert channels and red dots to flows without covert channels. In the left plot blue dots are superimposed for a better visualization. Figures correspond to the [ARES/CUING-2017 dataset].